The Dynamic Model: Sequence and State Chart Diagrams
Dynamic Model
- Remember that the dynamic model describes the internal behavior
of a system
- This can be illustrated in UML with interaction diagrams, statechart
diagrams, and activity diagrams
- Interaction diagrams describe behavior in terms of messages
exchanged between objects
- The sequence diagram is a specific kind of interaction
diagram
- Statechart diagrams describe the states of an individual object
and the possible transitions between states
- Activity diagrams model behavior in terms of activities.
Usually this illustrates a more general control flow
UML Sequence Diagrams
When are they used?
- During requirements analysis
- Help refine use case descriptions
- Help find participating objects
- Help identify responsibilities of classes
- Help identify necessary communication between objects
- During system design
- Can help refine subsystem interfaces
- Can help identify control flow and messages between objects, once
concrete classes are being designed
Notation
- A sequence diagram represents a graphical description of objects
participating in a single use case or scenario (illustrates communication
between objects and low of control)
- Arranged in general columns
- First item in each column is an actor, object, or class (using
usual notation for these things):
- Actor a stick figure
- Class a rectangle with class name inside
- Object a rectangle with underlined name (and type)
- A message is represented by an arrow from one column to
another. Usually labelled with an operation name, looking like a
function call.
- An activation is represented with narrow rectangle in a column.
Represents duration of an invoked operation
- Dashed lines between activations on the rest of the column -- just
shows that everything in the column is part of the same object/class
- A message arrow originates from one of the activations -- indicates
not only which object sent a message, but from inside which activated
operation (kind of like a function calling another function)
- Sequence diagrams can be based on either a use case or a scenario
- Can represent a use case with a more general flow of events, usually
the "main" flow. Can't really capture all variations with this
- Easier to represent a scenario -- a single example of the general use
case. Specific flow of events and choices
General guidelines for sequence diagrams
- Layout:
- Make 1st column correspond to the actor that initiates the use
case (or scenario)
- Make the 2nd column a boundary object (actor uses this to initiate
use case)
- Make the 3rd column a control object, which manages the rest of the
use case
- Object creation:
- Control objects should be created by boundary objects that
initiate use cases
- Control objects can create other boundary objects
- Access:
- Entity objects are accessed by boundary and control objects
- Entity ojects shouldn't call boundary or control objects.
This makes entity ojects easier to share across use cases
Examples
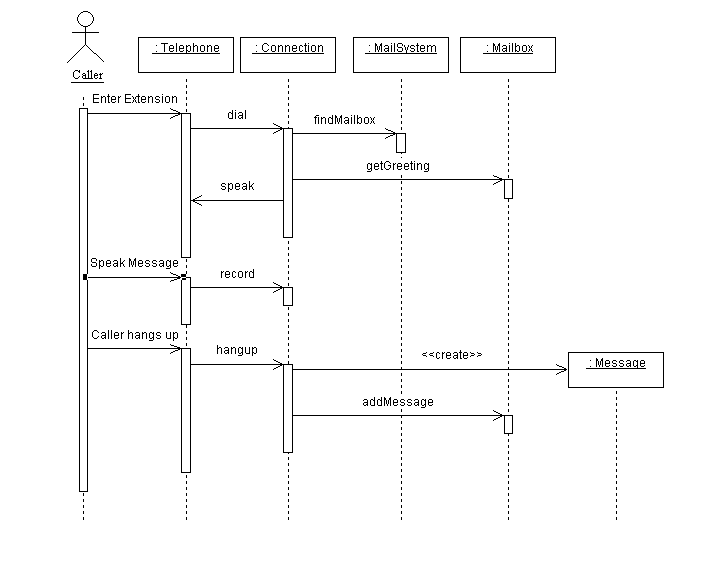
Here's a sequence diagram that represents a main flow through the
Leave A Message use case (from the voice mail example in
assignment #3).

Some other sequence diagrams can be found in the textbook:
- (pg 60) Figure 2-34: setting the time on a watch
- (pg 186-187) Figures 5-8, 5-9, 5-10: Sequence diagrams for
ReportEmergency use case, for the book's FRIEND case study
- (pg 213-214) Figures 5-26, 5-27, 5-28: Sequence diagrams for
AnnounceTournament use case, ARENA system case study
UML State Chart diagrams
Purpose
Used to describe a sequence of state transitions in an object in
response to events
- Can help identify important object attributes
- Can help refine the behavior description of an object
- Should focus on the important attributes that affect the object's
behavior
- Should be used to represent non-trivial behavior of a given object
type (or can apply to a subsystem)
Notation
- Similar to a finite state machine diagram (computer theory)
- A state
- is a condition satisfied by the attributes of the object (i.e.
determined by the current values in the attributes)
- is represented by a rounded rectangle
- A transition
- is a change of state triggered by an external event, a
condition, or perhaps time elapsed
- is represented by a directed edge (arrow) between states
- Transitions should be labelled to indicate the triggering event
Examples
Here is a statechart example from Java. It illustrates the states of a
thread object:

Explanation of states in this example:
- new -- represents a newly created Thread object. Not yet
running a task
- runnable -- a thread is now executing a task
- Note: this is referred to as runnable instead of
running because the processor still has to schedule threads
and processes to run and take turns
- asleep (timed waiting) -- a thread has been put to sleep with
a sleep() function call
- waiting -- a thread is blocked, waiting on a resource to
become available
- terminated -- a thread has finished its task and has been
shut down
Some other statechart examples from the textbook
- (pg 34) Figure 2-4: Statechart diagram for SetTime use case in the
watch example
- (pg 63) Figure 2-37: Statechart for Incident class of the
FRIEND case study
- (pg 63) Figure 2-38: A statechart for the watch example
- (pg 64-65) Figures 2-39, 2-40: More detailed statecharts for the
watch example
- (pg 195) Figure 195: A more detailed statechart for Incident
-- FRIEND case study
Some old powerpoint slides with diagram
examples (statecharts and sequence diagrams)


